
Make a market explainer people can read.
Put a figure on screen that reads on a phone and is sourced while you say it. Ticker tapes, exchange rates, portfolio breakdowns, runway charts and citation cards.

In short
Give a market explainer the desk furniture that makes a talking head look like a programme. Finance channels use CaliberVisual for ticker tapes, exchange rates, portfolio breakdowns, savings goals and runway charts, plus the lower thirds and citation cards that go around them. You type the numbers and labels in your browser, apply your channel's colours, and export a transparent MOV that sits over a screen recording or a talking head. Nothing here connects to a market data feed, which means the figure on screen is the one you chose and dated.
- 96
- Animations here
- 525
- In the library
- MP4, GIF, MOV
- Export
- 24 · 30 · 60 fps
- Frame rate
- 720p to 4K
- Resolution
- In the browser
- Editing
What finance creators put on screen
Numbers, moving
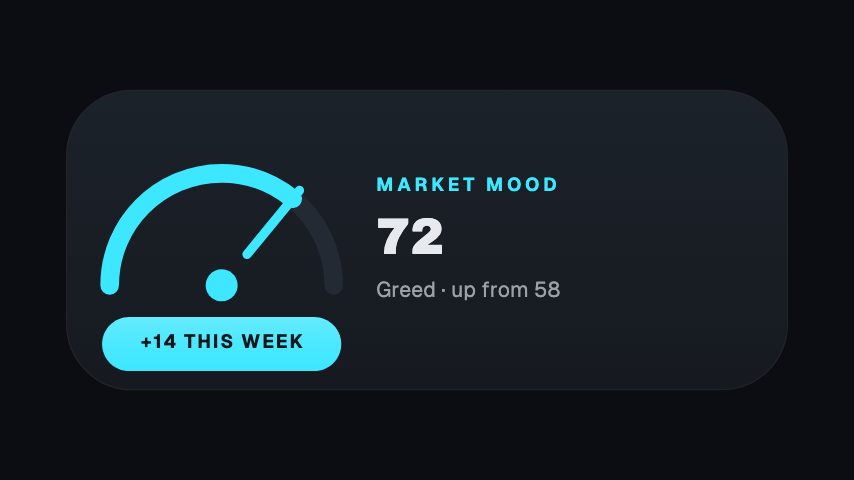
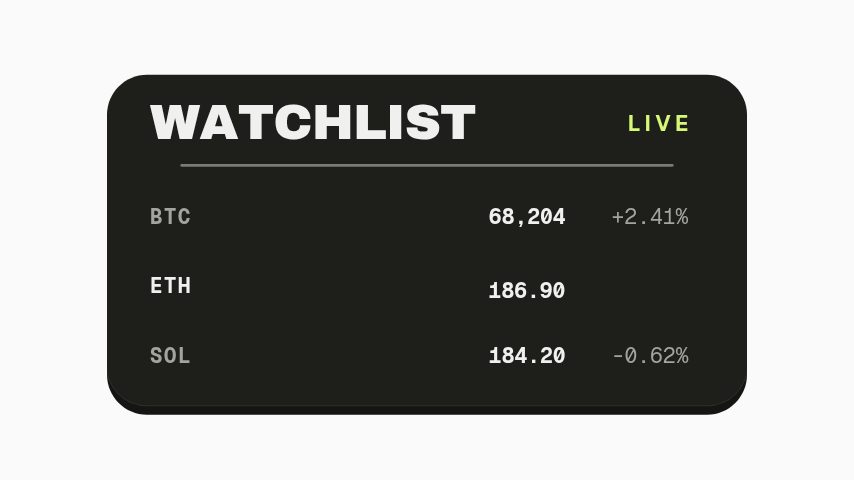
The market as motion: a tape along the bottom, a pair of currencies, a sentiment read, a line that is going somewhere. The furniture that makes a talking head look like a desk.
Break a position down
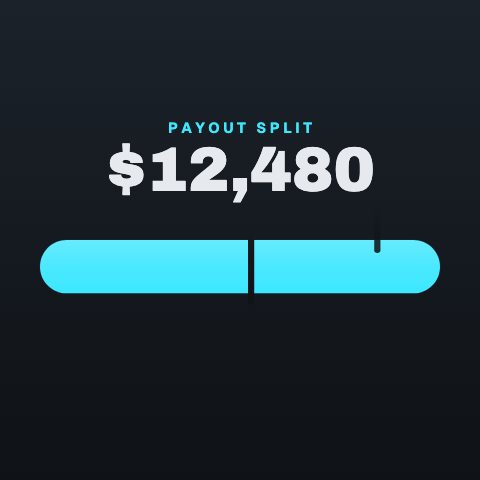
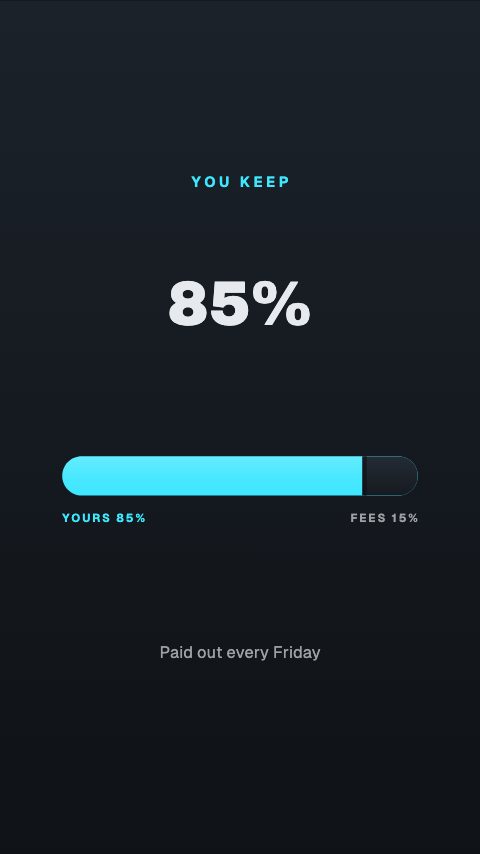
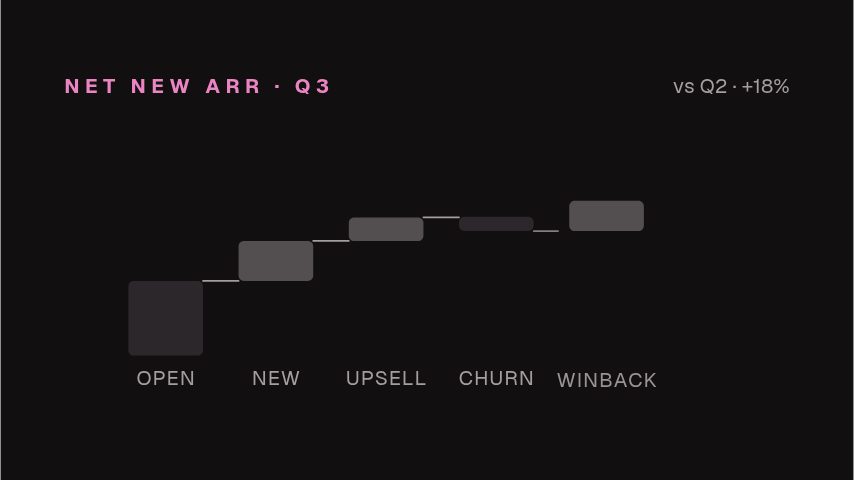
Where the money actually is. A donut for allocation, a split for revenue or payouts, a table when two options need comparing line by line.
Goals, runway and recurring revenue
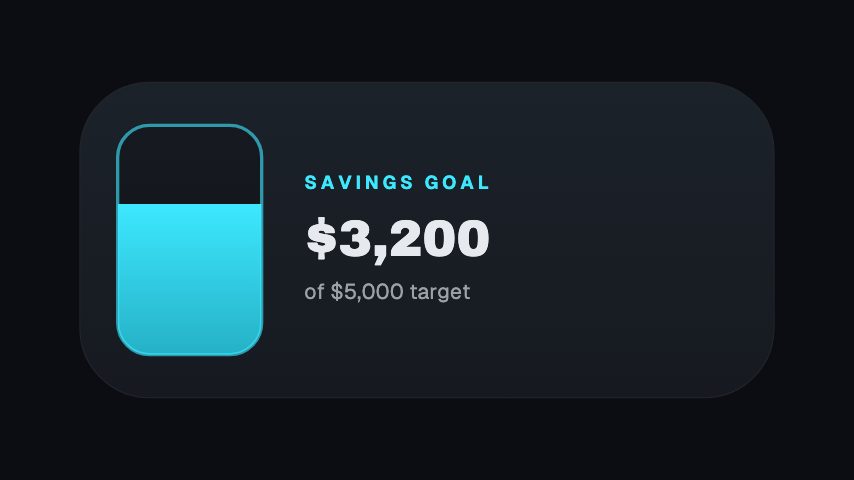
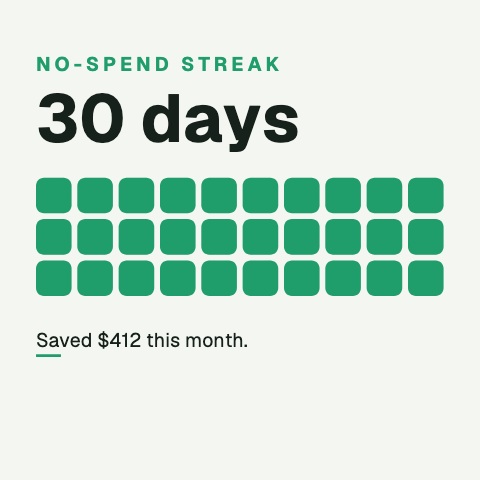
The founder-facing half of finance content. How long the money lasts, what recurs, what a target looks like as it fills.
Headline furniture
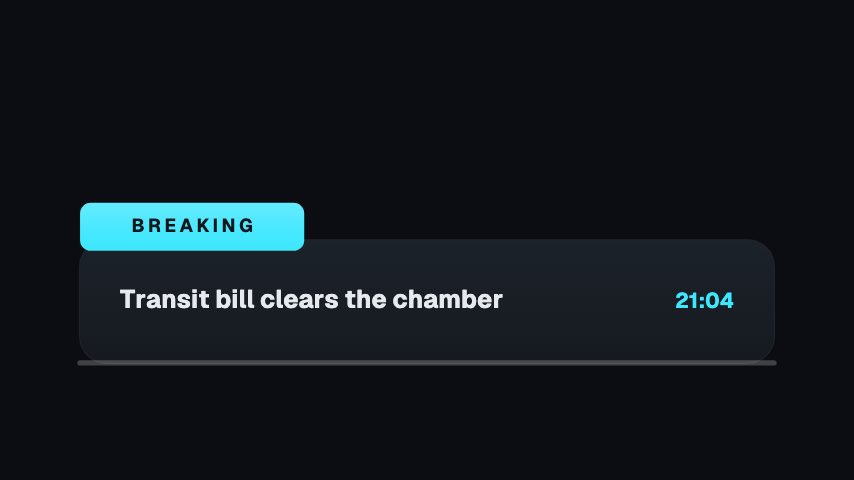
For the news segment: a banner that carries the story, a stack of headlines, a board that flips. Familiar shapes, which is the point, because a viewer knows what they are looking at before they read it.

How to add a ticker or chart graphic to a finance video
- 01
Pick the shape the figure needs
A tape for a run of prices, a donut for allocation, a card for one number, a table when two options need comparing.
- 02
Type in the numbers and the date
Set the figures you checked and the period they cover, so the graphic is honest about what it is showing.
- 03
Export MOV over your screen recording
Export with alpha and place it above the chart or terminal footage, so the thing you are pointing at is still visible.
How these land in your workflow
Numbers you type
No live feed, no API key, no stale widget. You set the figure and the date, which is also what makes it honest to leave on screen.
Over a screen recording
A transparent MOV composites over a chart, a terminal or a spreadsheet without hiding the thing you are pointing at.
Cite in frame
A source card belongs next to the claim rather than only in the description, and it is the graphic that separates analysis from assertion.
News-shaped furniture
Breaking banners, headline stacks and flip boards, for the segments where the format itself is doing some of the work.
Questions finance creators ask
Do the tickers pull live market data?
No. Every figure is a text field you fill in, so nothing on screen updates itself. That is a limitation and a feature: the number is the one you checked at the moment you exported, and it will not silently change under an old video.
How should I handle figures going stale?
Put the date or the period in the graphic, since most of these have a field for exactly that, and treat the export as a record of a moment rather than a live readout. It is the same discipline as a chart in a slide deck.
Can I use these in videos that discuss investments?
Yes. They are graphics rather than advice, and any disclaimer your jurisdiction requires is yours to add, usually as a caption bar you can keep on screen for the segment.
Will they read on a phone?
The type is set for it, but the density is up to you. A portfolio donut with five slices reads on a phone and one with fifteen does not. Where a figure has to be legible, give it its own card rather than a row in a table.
Can I match a channel's existing look?
Yes. A brand kit carries your colours, typeface and logo across every animation you open, which is what keeps a ticker, a lower third and a citation card looking like one programme.
Every animation for finance creators
Finance
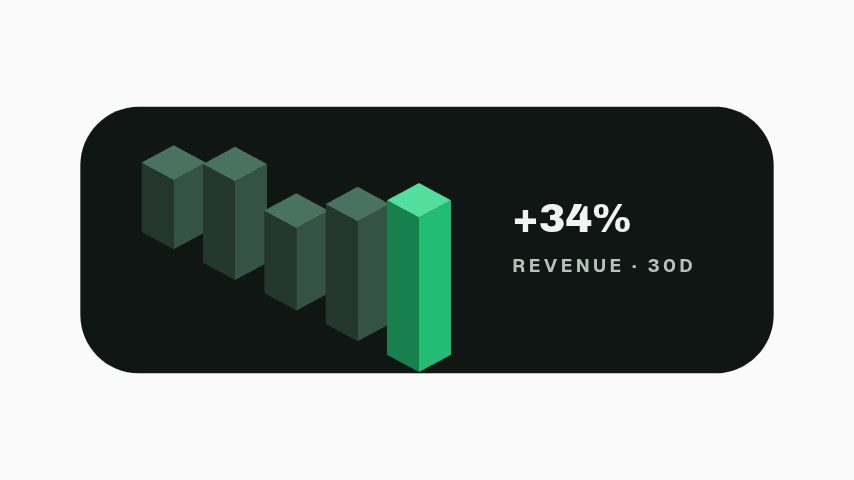
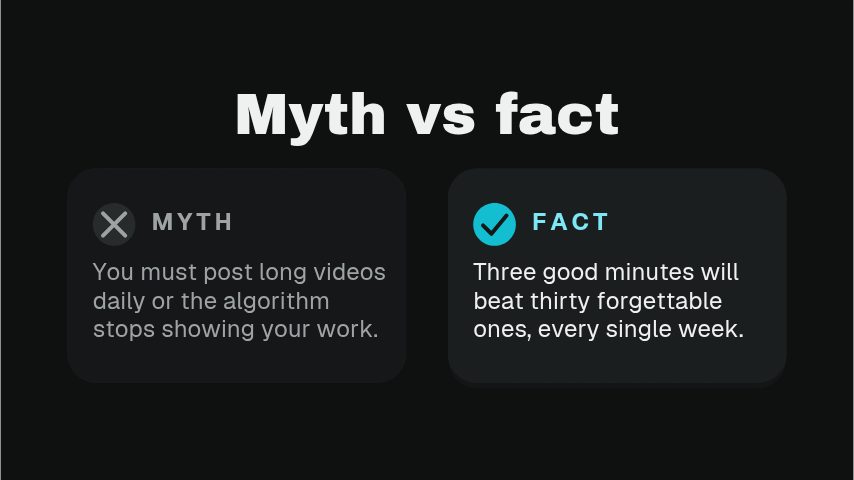
5 finance animations, editable in the browser and exported straight from it.
Broadcast
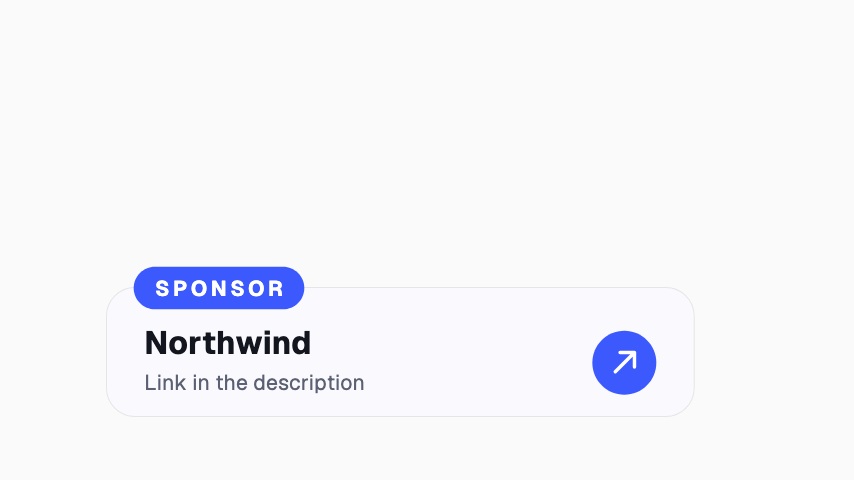
12 broadcast animations, editable in the browser and exported straight from it.




Education
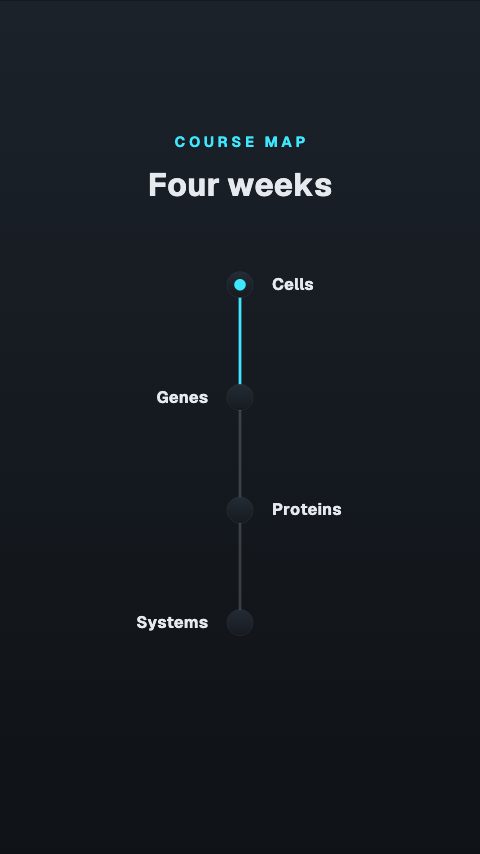
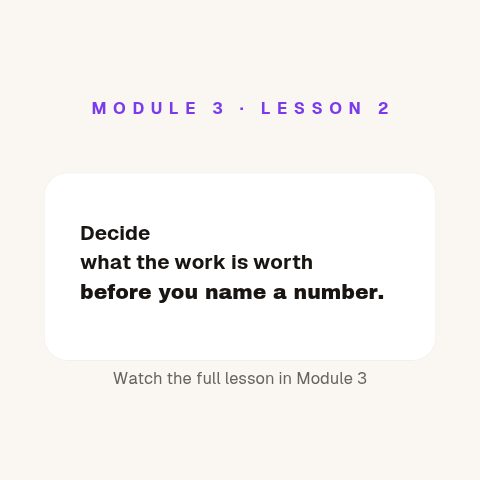
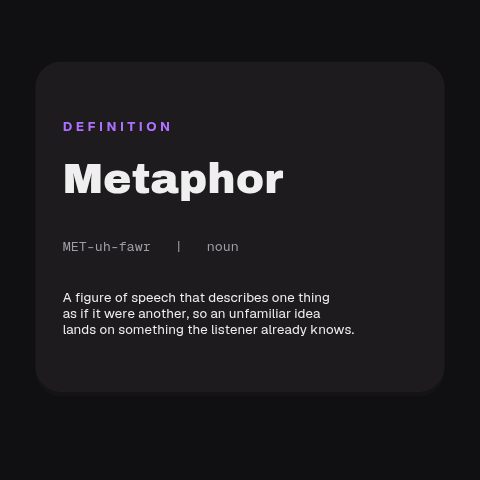
9 education animations, editable in the browser and exported straight from it.
Commerce
68 commerce animations, editable in the browser and exported straight from it.
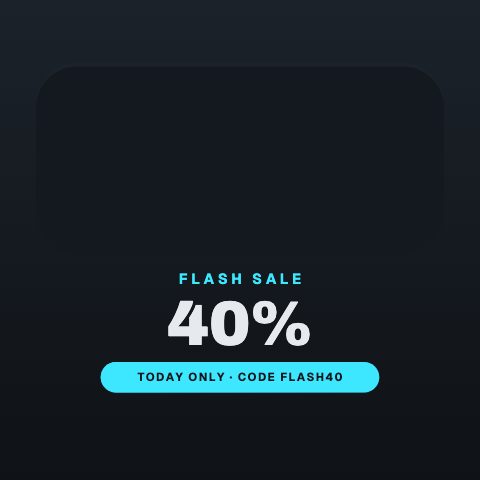 Flash Sale4s
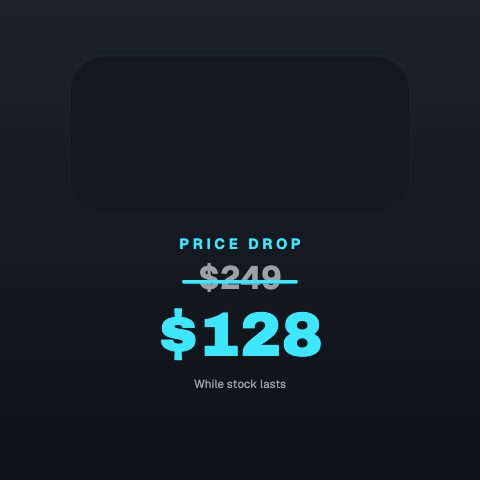 Price Drop4s
 Free Shipping4s
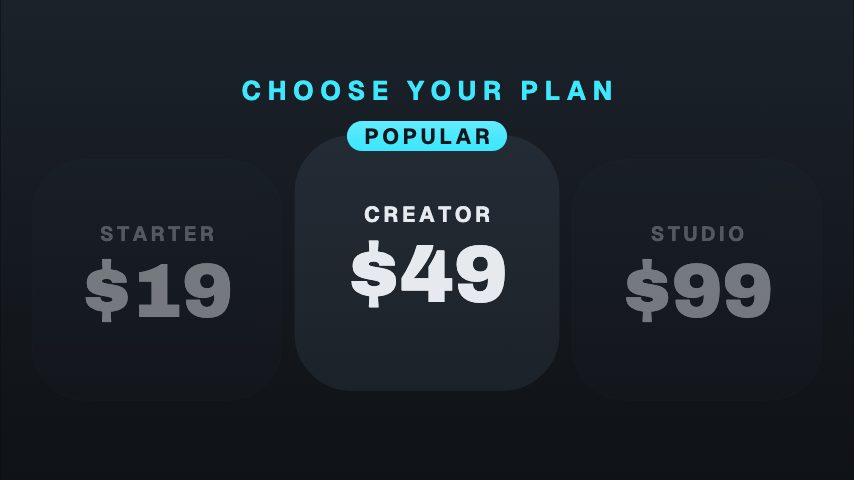 Price Ladder4s
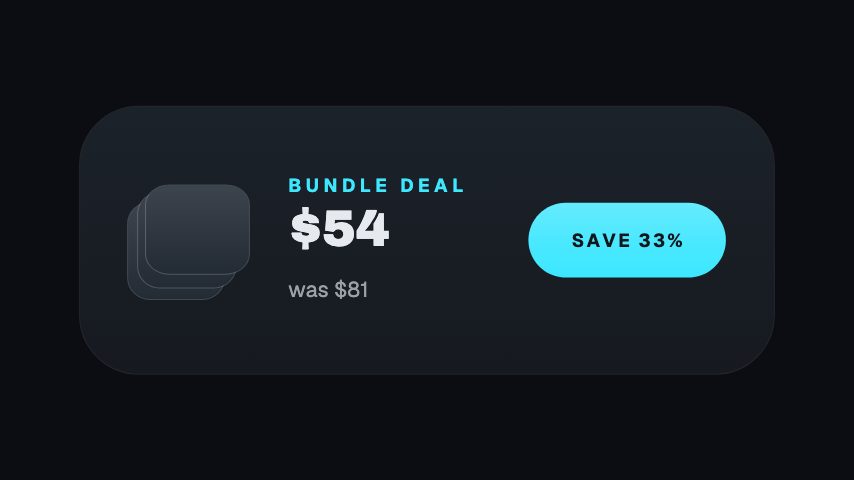 Bundle Save3s
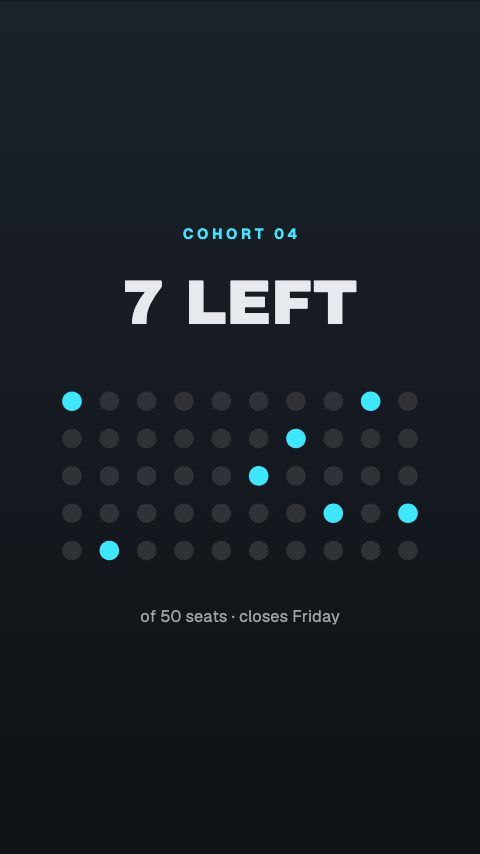 Spots Left4s
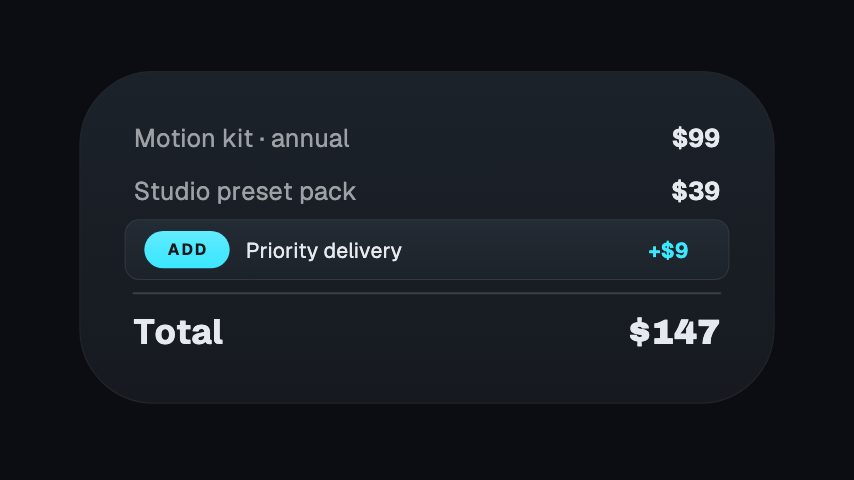 Upsell Bump3s
- Payout Split4s
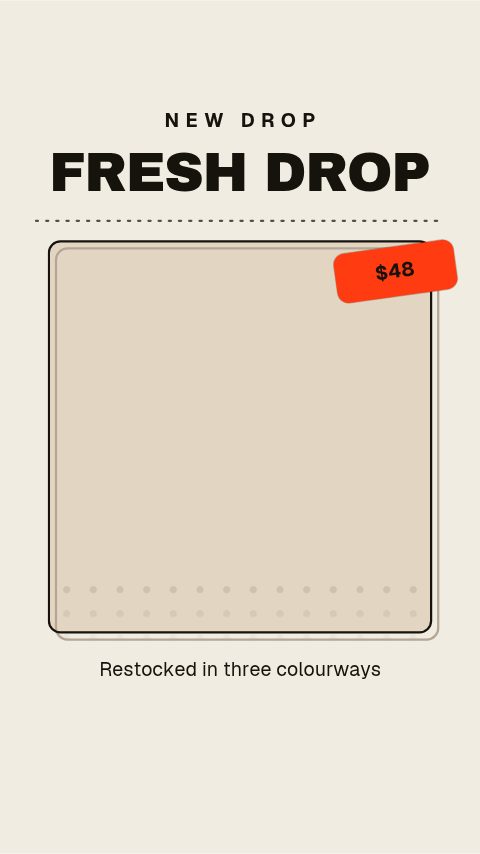 3-Second Product Hook3s
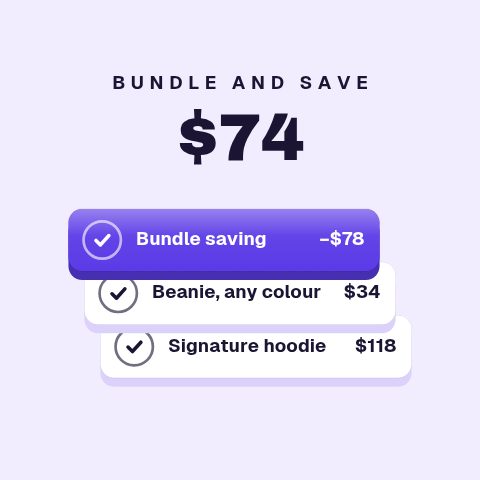 Offer Stack Builder4.4s
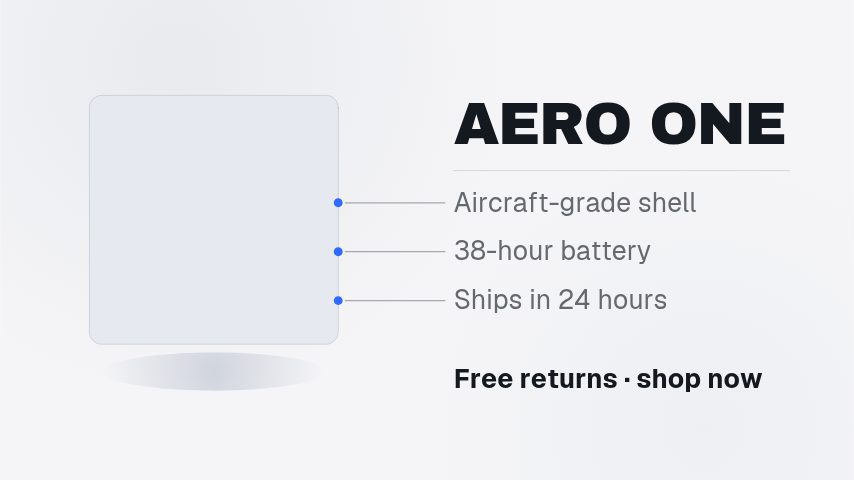 Dynamic Product Showcase5s
 Discount Code3s
 Order On The Way4.4s
 Share Split Bar3s
 Drop Lookbook10s
 Colourway Drop4.2s
 Stock Burndown4.4s
 Die-Cut Price Ticket4.2s
 Pull-Back Deal Card4.4s
 Complete The Look4.6s
 Material Detail4.2s
 Waitlist Queue3.2s
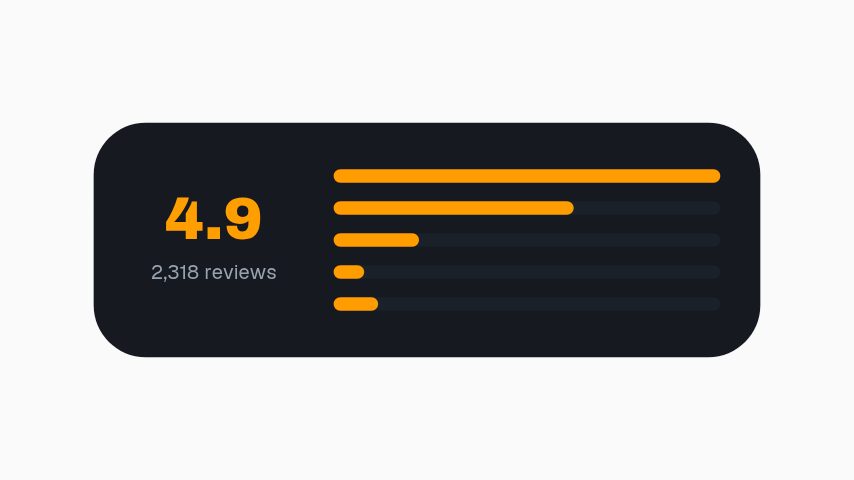 Rating Breakdown3.2s
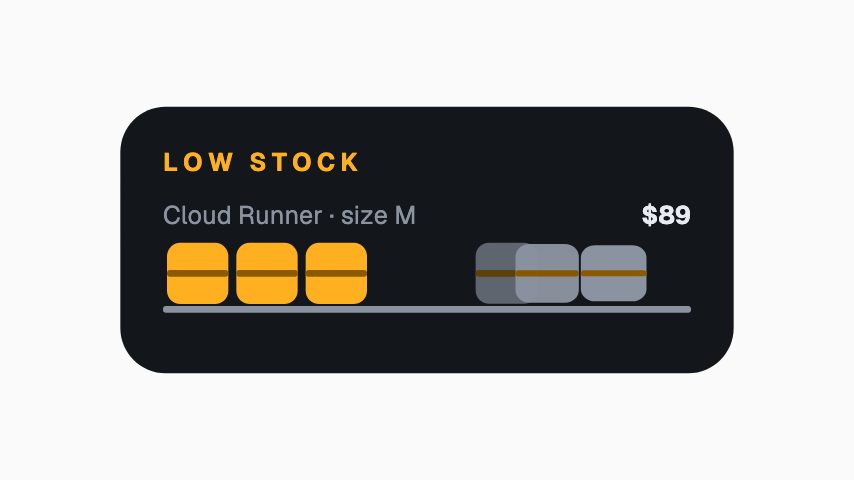 Only X Left3s
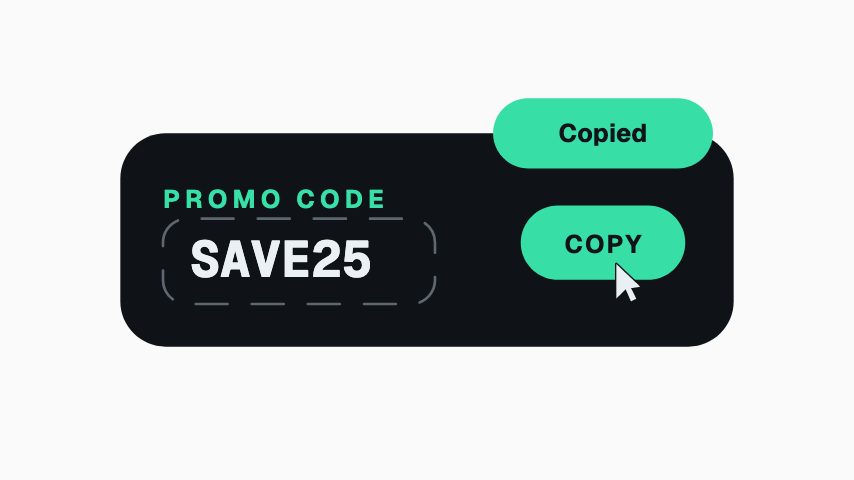 Promo Code Copy3s
 Corner Sale Flag3s
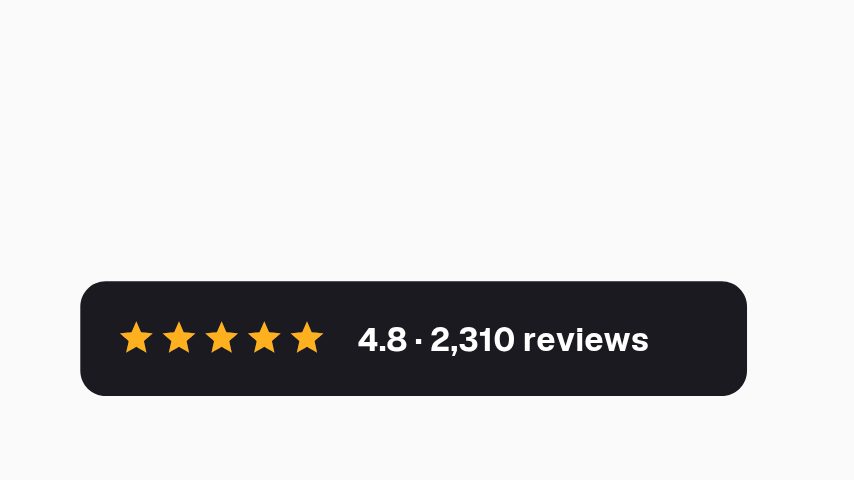 Rating Lower Third3s
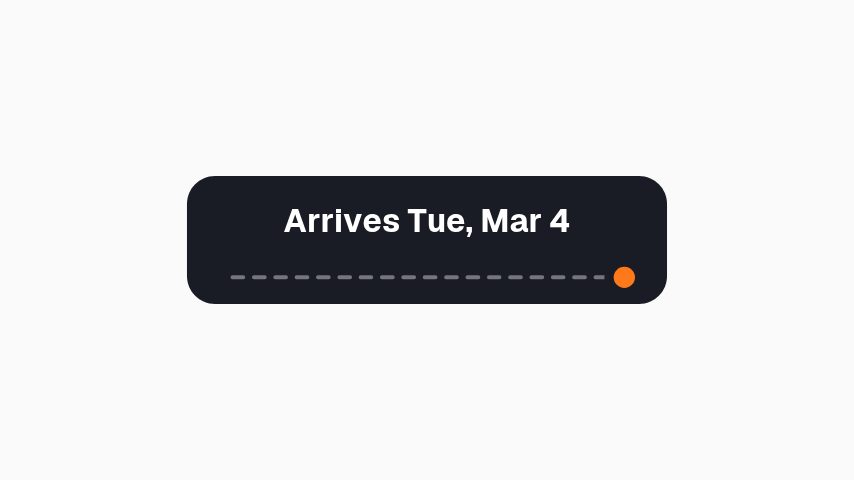 Arrives By3s
 Add To Cart Button3s
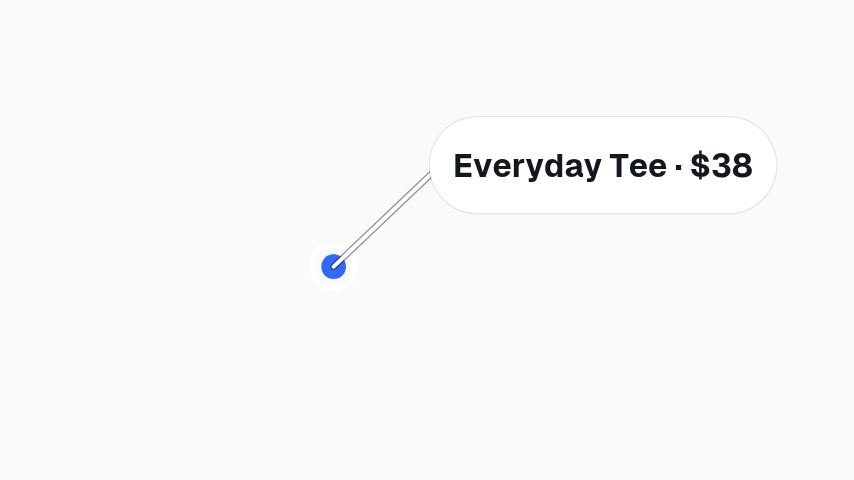 Price Tag Callout3s
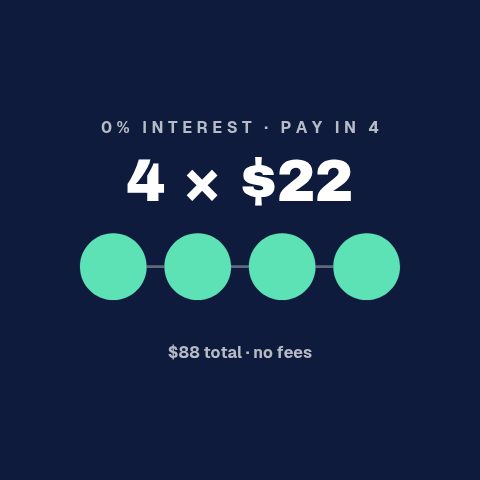 Pay In 44s
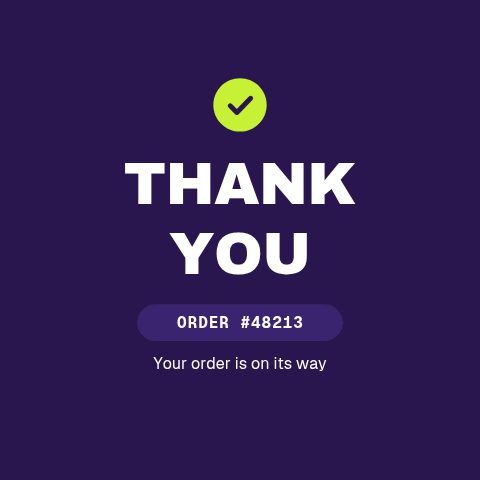 Thank You Order4s
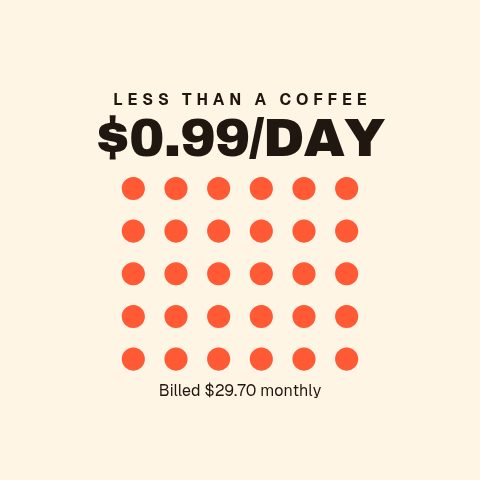 Per Day Price4s
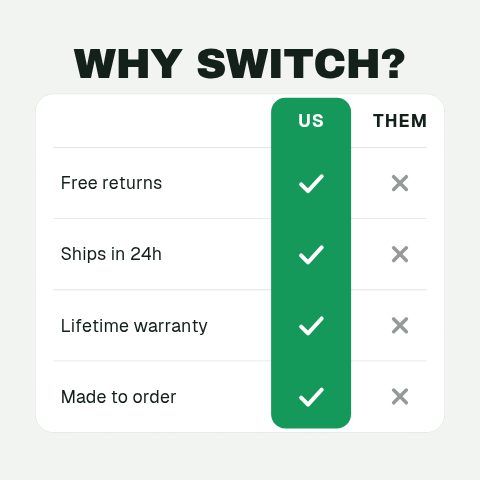 Us vs Them5s
 Product Carousel5s
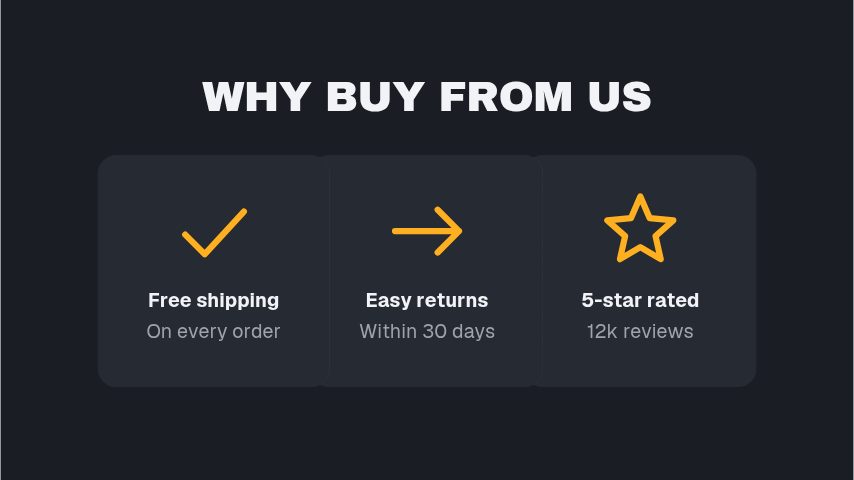 Why Buy From Us4s
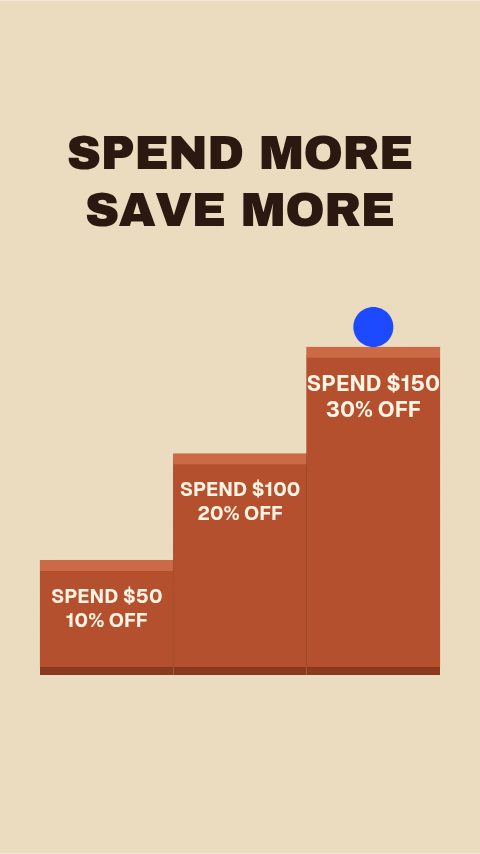 Spend More Save More5s
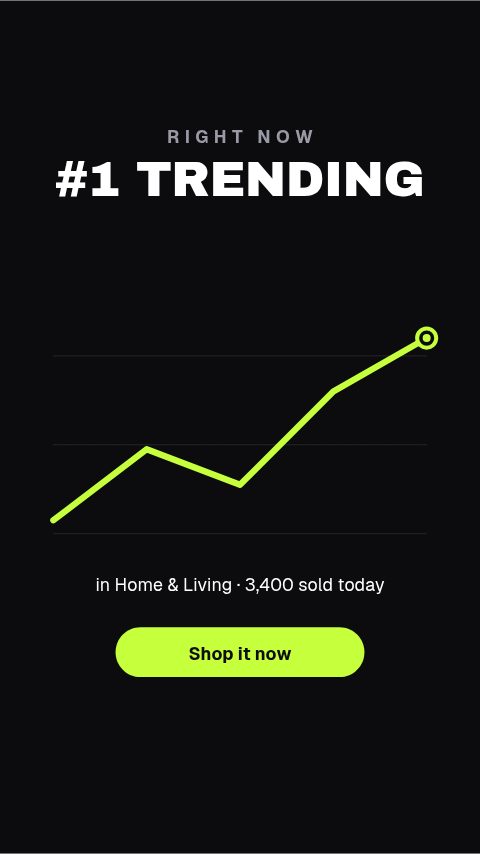 Trending Now4s
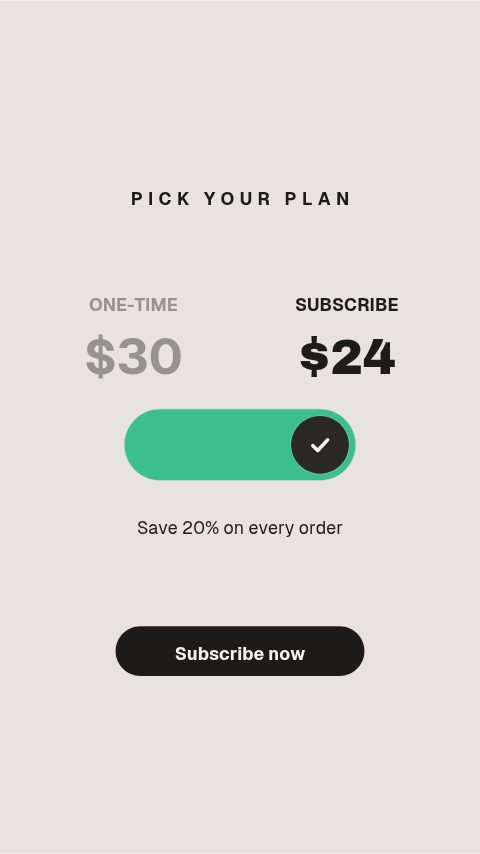 Subscribe & Save4s
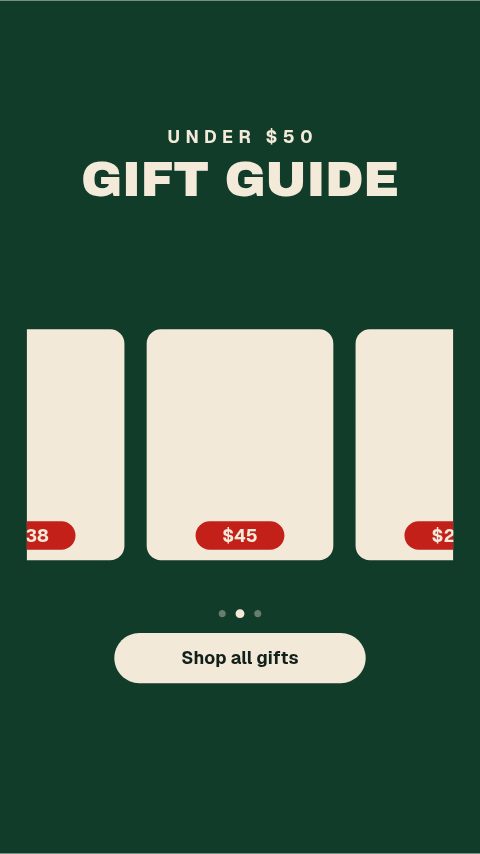 Gift Guide Rail5s
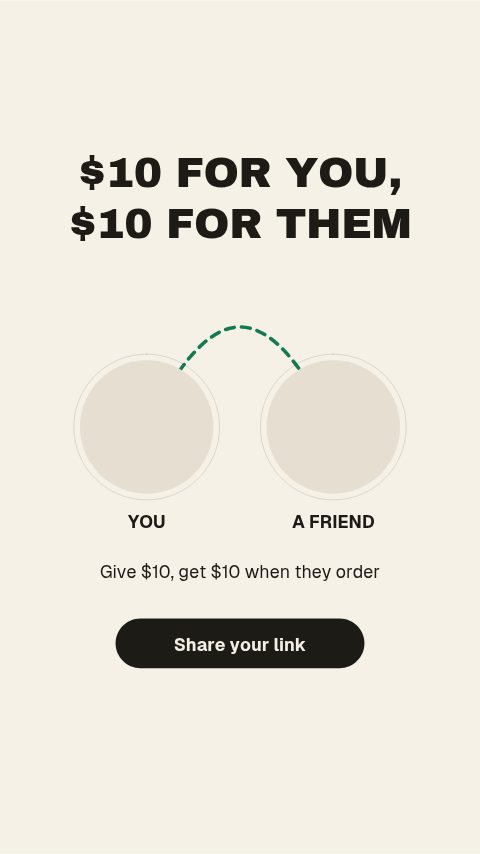 Refer A Friend4s
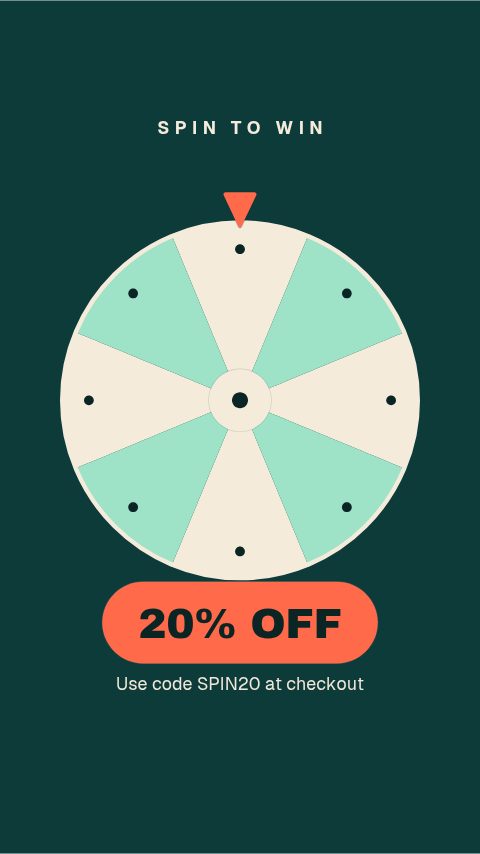 Spin To Win5s
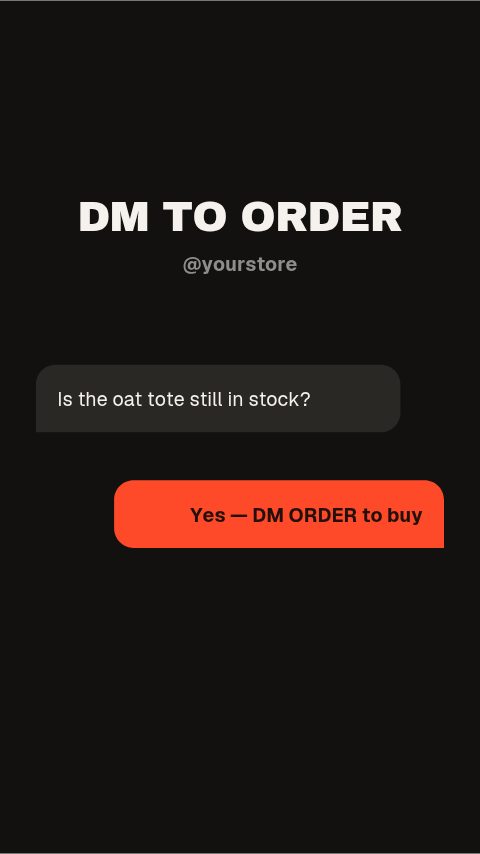 DM To Order4s
 Free Gift With Purchase4s
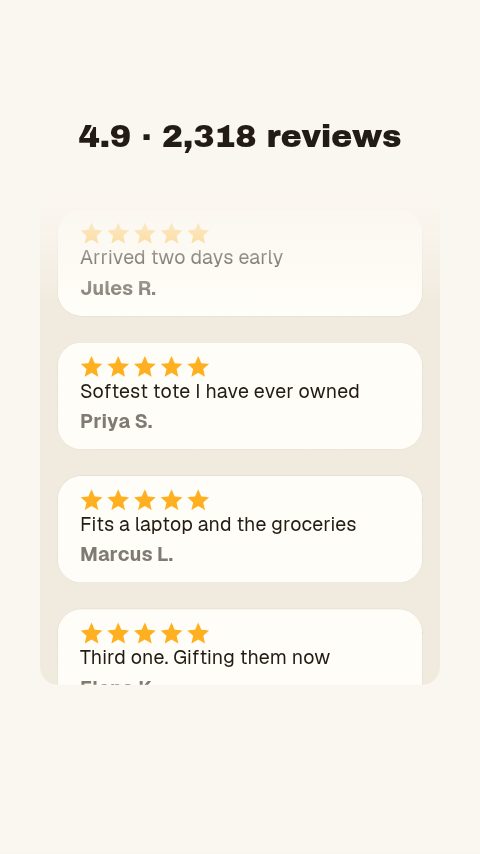 Review Feed5s
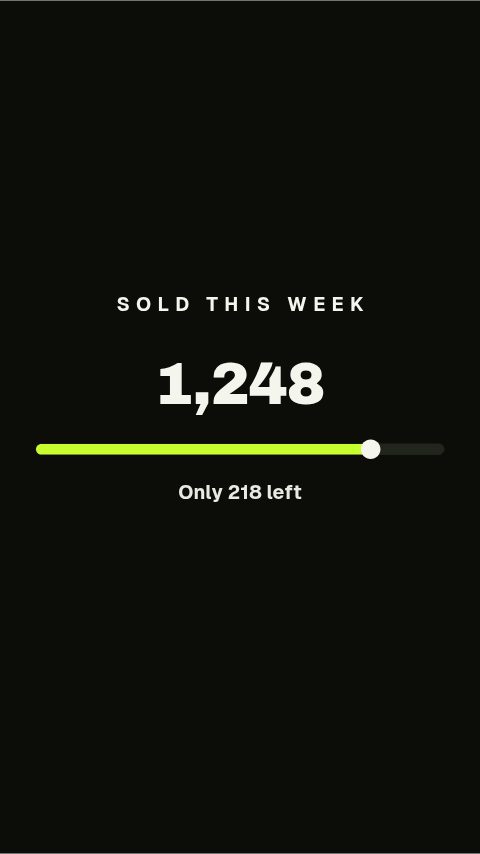 Sold This Week4s
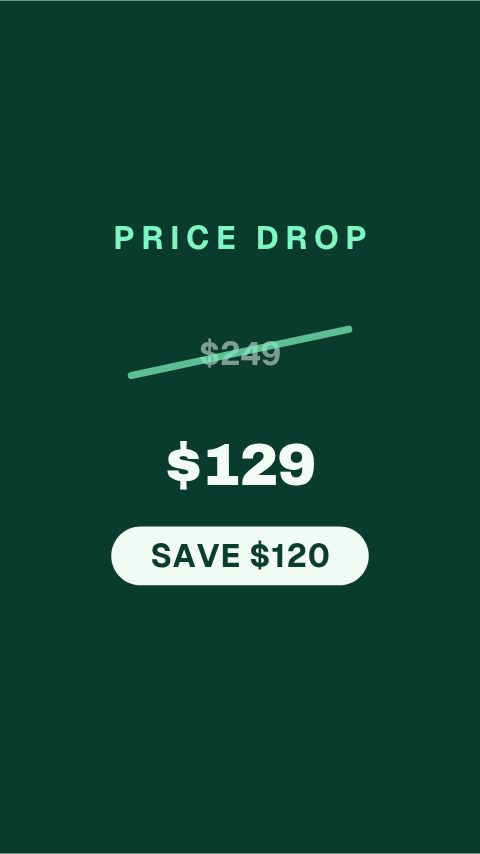 Was / Now Price Drop4s
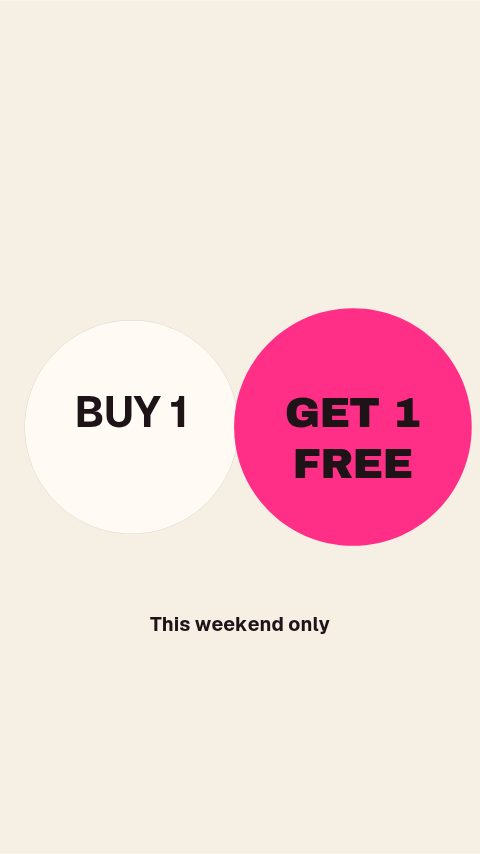 Buy One Get One4s
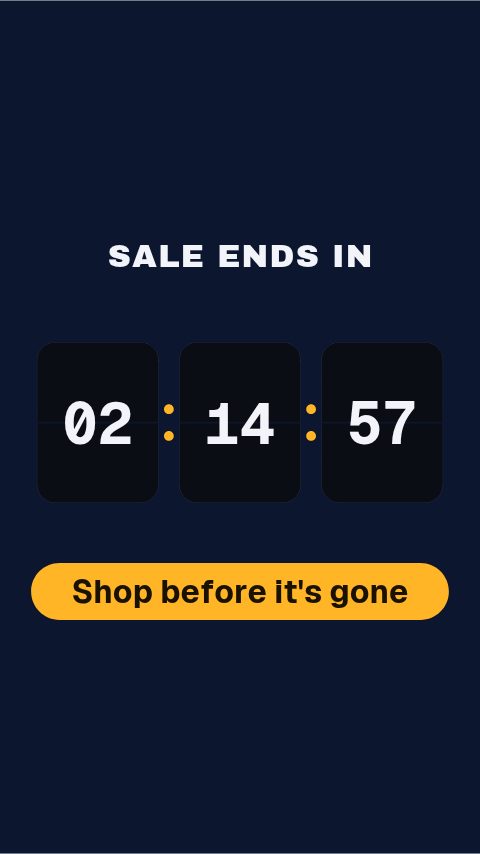 Flip Clock Countdown5s
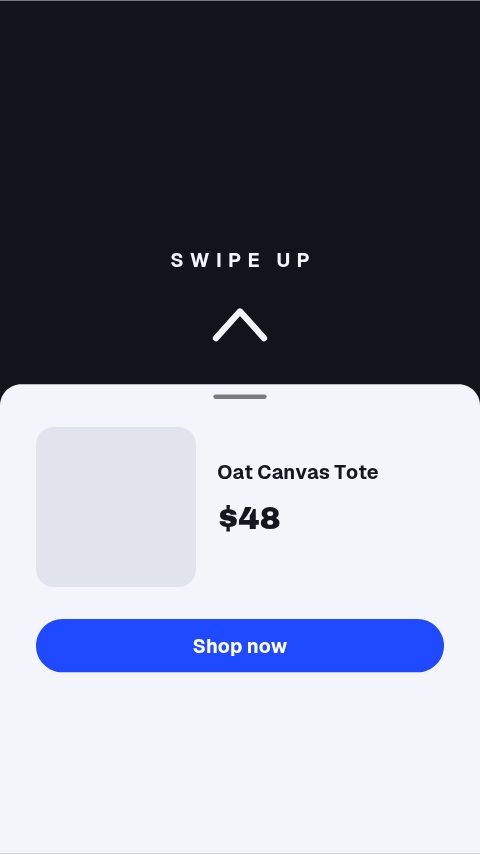 Swipe Up Shop Sheet4s
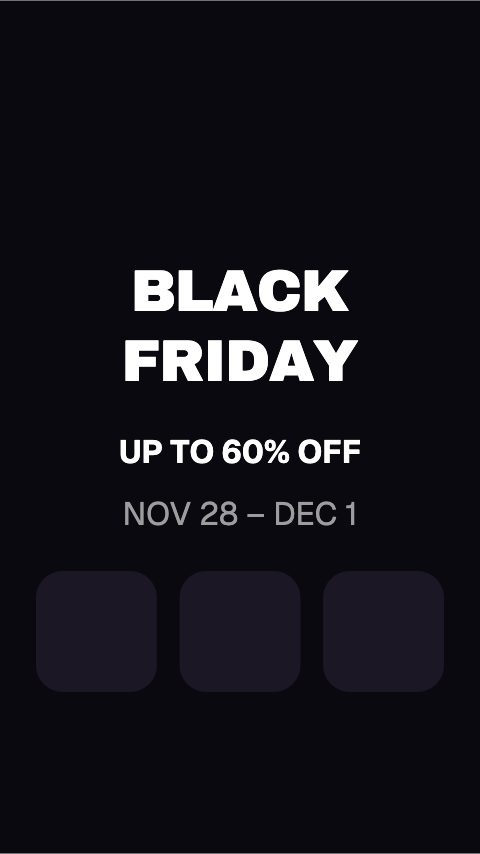 Black Friday Glitch4s
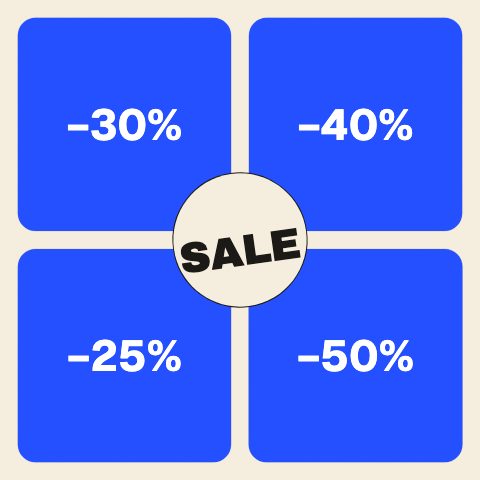 Sale Grid Flip5s
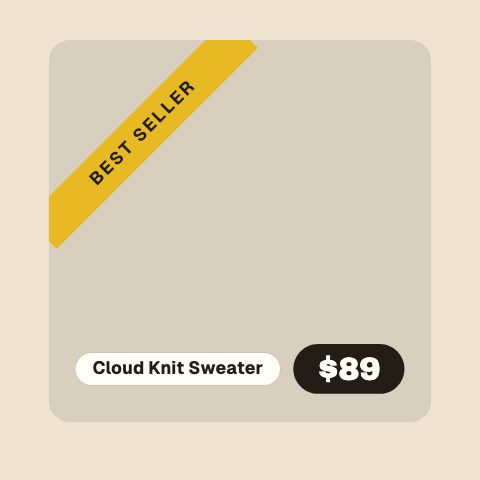 Best Seller Ribbon4s
 Sold Out Stamp4s
 Variant Selector4s
 Free Gift Unlock5s
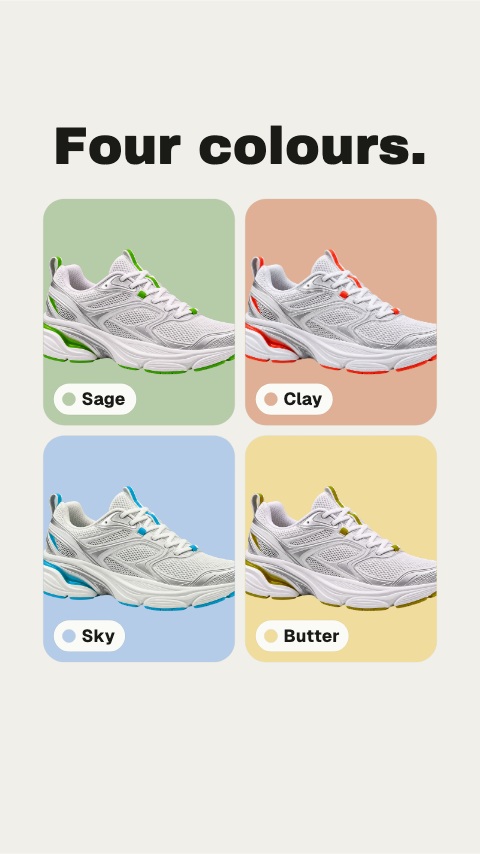 Colourways5s
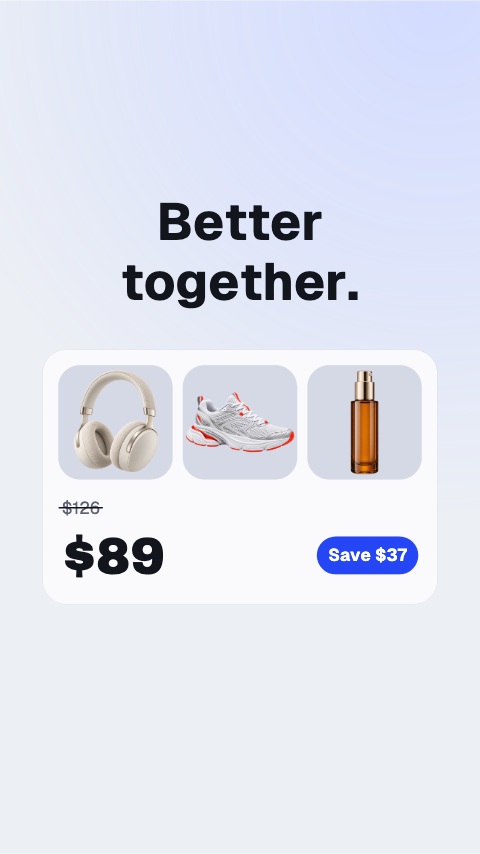 Bundle Offer5s
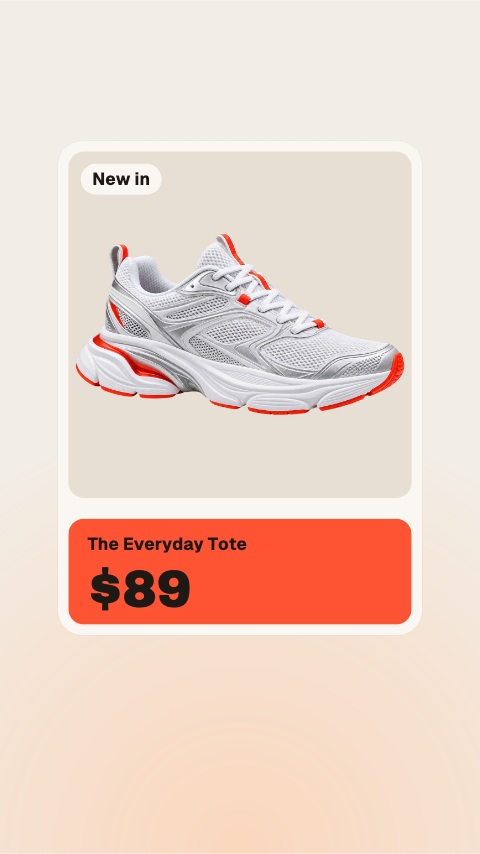 New Arrival9s
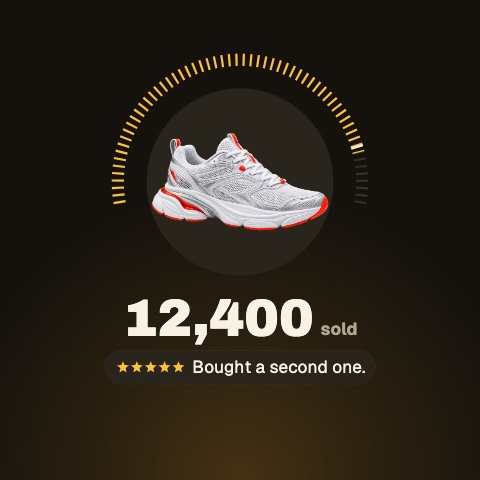 Bestseller5s
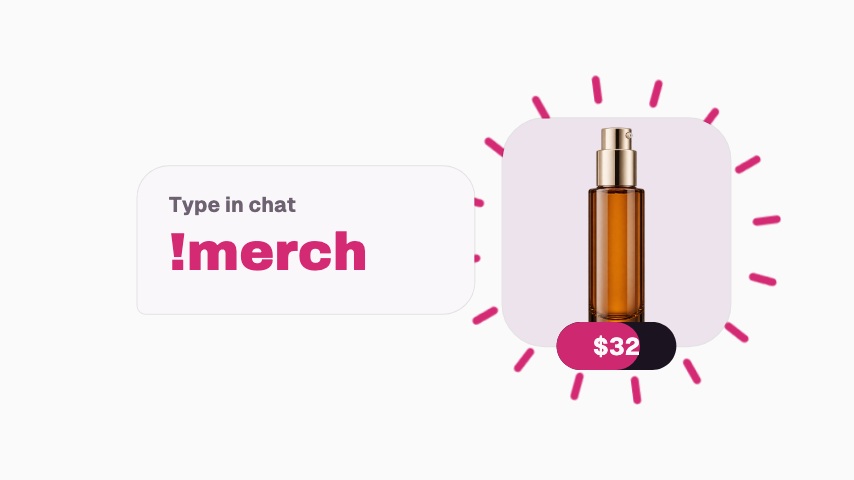 Merch Chat Command3.5s
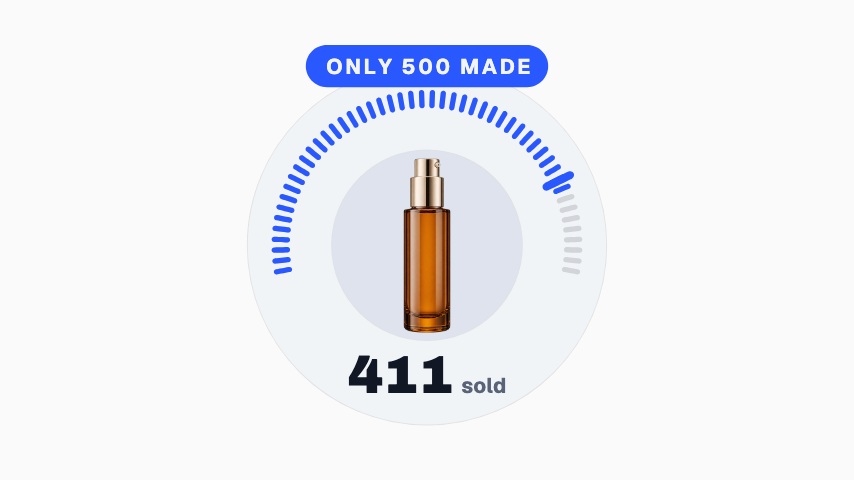 Limited Run3.2s
 Merch Code3s
 Merch Shelf4s
 Merch Drop Alert3s
 Launch Ad10s
 Fan Wall3.2s
 Scan to Shop3.3s
Not quite you?
Make the point land the second you make it.
Hold a viewer through the part of a lesson that words alone make longer. Key terms, timelines, comparisons, quiz reveals and citations, one clear graphic at the second it is needed.
8 animationsShip the launch post the day you ship.
Get the announcement out the day the feature ships. Release notes, interface states, revenue cards and launch frames, made by whoever is shipping rather than by a design ticket.
6 animationsTurn an episode into a week of clips.
Get an audio show seen in a feed that plays silently. Guest intros, pull quotes, chapter markers, audiograms and sponsor slates, for the video feed and for the clips account.
8 animations
Open one and export something today
All 96 of these open on Pro, free for seven days. Cancel any time.
Start free